 Synoptic Meteorology(I)
1. Introduction to Synoptic Meteorology
The word synoptic means "view together" or "view at a common point". Therefore, synoptic meteorology is primarily concerned with viewing the weather at a common point -- time.
Also known as large scale or cyclonic scale, the size of weather patterns we are looking at range upwards from about 620 miles (1,000 kilometers) across to about 1,500 miles (2,500 kilometers).
When different parameters of the earth's atmosphere are viewed together at the synoptic scale then large-scale weather patterns emerge, such as extratropical cyclones and their associated fronts.
One of the primary things a good meteorologist will check is the "time" these various weather elements were observed.
2. Z-time (Coordinated Universal Time)
All aspects of meteorology are based upon a world-wide 24-hour clock called Zulu time (Z), more commonly called Coordinated Universal Time (UTC). You will notice all weather maps, radar, and satellite images all have their time expressed in "Z". The Zulu term stems from military usage while Coordinated Universal Time is the civilian term for this 24-hour clock.
The origin of these time zones began in the mid 1800's in England. In 1852 the Royal Observatory in Greenwich, England began transmitting time telegraphically and just three years later became the standard time in most of Great Britain. Also, charts and maps were made with reference to the observatory as the "zero" or prime meridian.
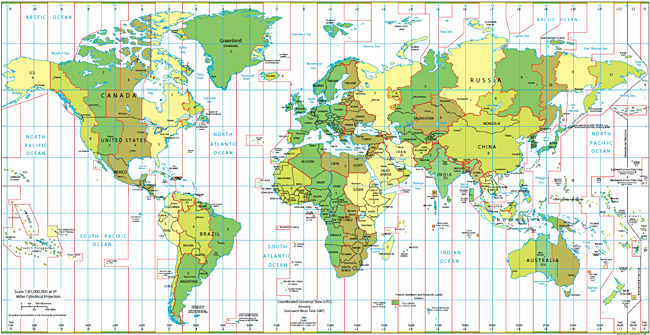
Map of the world's time zones.
Over the next few decades a number of locations around the world had developed their own meridians as reference points. The Greenwich meridian was the most popular of these in part due to the reputation for reliability and correctness of the Greenwich Observatory's publications of navigational data.
In 1884, a conference in Washington, D.C. settled the matter where it was agreed to establish a single "prime" meridian (0° longitude), passing through Greenwich. This was for both for longitude and timekeeping. This 0° meridian divides the Eastern from the Western Hemisphere. Today, one can visit the Royal Observatory and straddle this 0° meridian with one foot in each hemisphere.
With the 360° daily rotation of the earth, the sun is moving 15° each hour which leads to the formation of 24 time zones. However, today the individual zone boundaries are no longer straight, nor are they always continuous, as they have been modified for convenience and to satisfy the desires of sovereign nations.
Time zone offsets are identified as -12 UTC through 0 to +12 UTC with the minus values signifying time "before" or ahead of prime meridian (which is the Western Hemisphere). At the meeting of the -12 and +12 time zones is the International Date Line.
Moving west across the International Date Line one moves from the -12 UTC time zone to the +12 UTC time zone. This means you advance the clock 24 hours; in essence you advance one day on the calendar. Moving east across the International Date Line means subtracting 24 hours from the clock thereby reversing one day on the calendar.
The 24-hour clock (Z-time) begins at midnight (00Z) at this prime meridian. Z-time does not change with the change for daylight saving time but the local time will change.
Z TIME RIDDLE
Riddle: If it is 4 Z in Boston then what Z time is it in Los Angeles?
Answer to Riddle: All locations on Earth have the same Z time at any one time. Z time standardizes time for all locations on earth. When it is 4 Z in Boston it is 4 Z everywhere. The time that is different is the local time. When it is 11 pm in Boston it is 8 pm in Los Angeles. The most common incorrect answer to this riddle is 1 Z. When the 12 Z sounding is taken, all balloon stations launch to get upper air data at the same time. When using Z time it is easier to have something done at the same time at various locations since no adjustment to time zones is needed. All locations on Earth use the time at the prime meridian for Z time.
Regardless which weather map, radar, or satellite picture you view, be sure to first check the time of the image.
3. Weather Chart
Weather charts are the fundamental basis for weather analysis and forecasts. They are based on the data collected by weather stations on the ground and on the data recorded at high altitudes by probes and satellites. Most modern instruments are able to guarantee a continuous recording of atmospheric data, but the weather charts are created using the data recorded at preset conventional timings, so that they may be comparable with one another in different locations around the world. The timings set by the World Meteorological Organization are called synoptic hours and are at 00:00-06:00-12:00-18:00 hrs.
The related charts are known as synoptic weather charts. All the world stations are connected by networks managed by the World Meteorological Organization and for Europe, by The International Network of European Meteorological Services and the charts are created using standard criteria and symbols, so that they can be compared with each other. A weather chart includes an isobar chart and the representation, with opportune symbols, of the principal atmospheric parameters, such as wind direction and speed, types of clouds and extension of the cloud formations, the position of warm, cold and occluded fronts and the high and low pressure centres.
Weather charts can describe the weather conditions on ground, or at high altitudes, and are the basis for the creation of weather forecast maps.
4. Cyclone Model
If you track low pressure areas and fronts you will often notice a particular cycle these systems undergo. The Norwegian cyclone model, so named to honor the Norwegian meteorologists who first conceptualized the typical life cycle of cyclones in the 1910s and 1920s.
Initial Condition
In this model, there will initially be a boundary, or front, separating warm air to the south from cold air to the north. The front is often stationary.
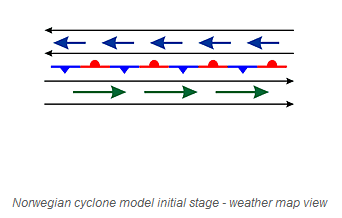

Beginning Stage
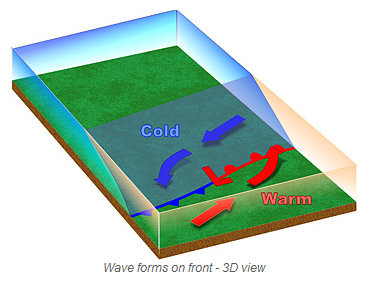
A wave develops on the front as an upper level low pressure system, embedded in the jet stream moves, over the front. The front develops a "kink" where the wave is developing. The stationary front changes into a cold front and warm front as the air masses begin to move. Precipitation will begin to develop with the heaviest occurrence along the front (dark green).

Intensification
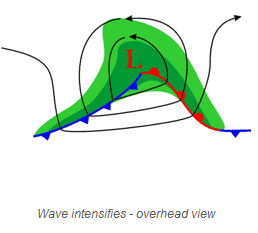
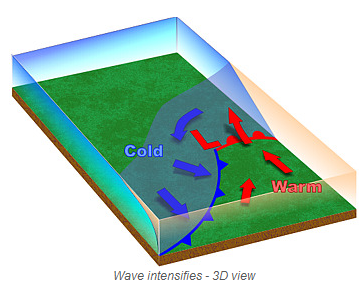
As the wave intensifies, both cold and warm fronts become better organized.
Mature Stage
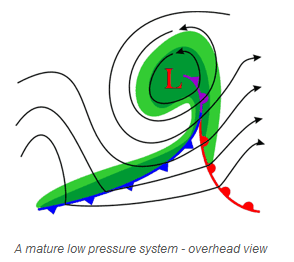
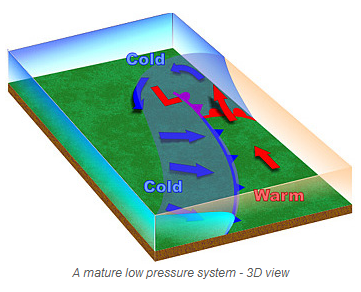
The wave becomes a mature low pressure system, while the cold front, moving faster than the warm front, "catches up" with the warm front. As the cold front overtakes the warm front, an occluded front forms.
Dissipation
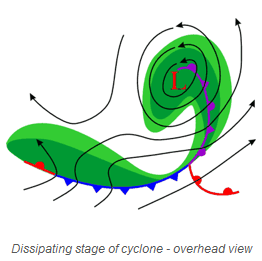
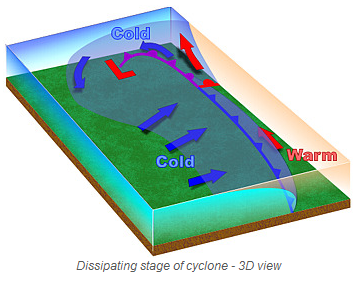
As the cold front continues advancing on the warm front, the occlusion increases and eventually cuts off the supply of warm moist air, causing the low pressure system to gradually dissipate.
